Pyharmonics documentation
Pyharmonics detects harmonic patterns in OHLC candle data for any stock or crypto asset. See Scott Carney’s books at harmonictrader.com for more information on harmonic patterns and follow author Scott Carney yourself.
A video tutorial https://www.youtube.com/watch?v=oLPU_f7AiGE will walk you through installation.
Installation
I recommend using a virtual env.
From git
$ git clone git@github.com:niall-oc/pyharmonics.git
$ cd pyharmonics
$ pip install .
$ cd src
$ python
>>> from pyharmonics.marketdata import BinanceCandleData
From pypi
$ pip install pyharmonics
$ python
>>> from pyharmonics.marketdata import BinanceCandleData
The guides below provide code snippets. For a full spec of the API click on the `src` link at the bottom of the table of contents.
Mini Guide
Use the market data features or generate your own market data matching the dataframe schema below. close_time, dts can be omitted
 1>>> from pyharmonics.marketdata import BinanceCandleData
 2>>> b = BinanceCandleData()
 3>>> b.get_candles('BTCUSDT', b.MIN_15, 1000)
 4>>> b.df
 5>>> b.df
 6                              open      high       low     close     volume  close_time                       dts
 7index
 82023-07-09 07:44:59+01:00  30249.04  30267.04  30233.79  30262.33   79.71611  1688885099 2023-07-09 07:44:59+01:00
 92023-07-09 07:59:59+01:00  30262.32  30267.87  30235.00  30254.79  136.31718  1688885999 2023-07-09 07:59:59+01:00
102023-07-09 08:14:59+01:00  30254.80  30283.50  30233.33  30283.50  185.04086  1688886899 2023-07-09 08:14:59+01:00
112023-07-09 08:29:59+01:00  30283.50  30283.50  30263.37  30263.37   74.17937  1688887799 2023-07-09 08:29:59+01:00
122023-07-09 08:44:59+01:00  30263.37  30270.09  30243.10  30257.30  121.15791  1688888699 2023-07-09 08:44:59+01:00
13...                             ...       ...       ...       ...        ...         ...                       ...
142023-07-19 16:29:59+01:00  29841.37  29902.00  29841.36  29878.00  267.42077  1689780599 2023-07-19 16:29:59+01:00
152023-07-19 16:44:59+01:00  29878.00  29933.00  29866.15  29890.01  245.03318  1689781499 2023-07-19 16:44:59+01:00
162023-07-19 16:59:59+01:00  29890.01  29995.16  29890.00  29956.46  611.16786  1689782399 2023-07-19 16:59:59+01:00
172023-07-19 17:14:59+01:00  29956.46  29979.00  29901.70  29930.57  365.35485  1689783299 2023-07-19 17:14:59+01:00
182023-07-19 17:29:59+01:00  29930.57  29930.57  29870.00  29901.40  244.14513  1689784199 2023-07-19 17:29:59+01:00
19
20[1000 rows x 7 columns]
Create a technicals object for further analysis.
1>>> from pyharmonics.technicals import Technicals
2>>> t = Technicals(b.df, b.symbol, b.interval)
Search for a harmonic pattern.
1>>> from pyharmonics.search import HarmonicSearch
2>>> m = HarmonicSearch(t)
3>>> m.search()
Plot the findings.
1>>> from pyharmonics.plotter import Plotter
2>>> p = Plotter(t, 'BTCUSDT', b.MIN_15)
3>>> p.add_harmonic_plots(m.get_patterns(family=m.XABCD))
4>>> p.show()
You will see something like this.

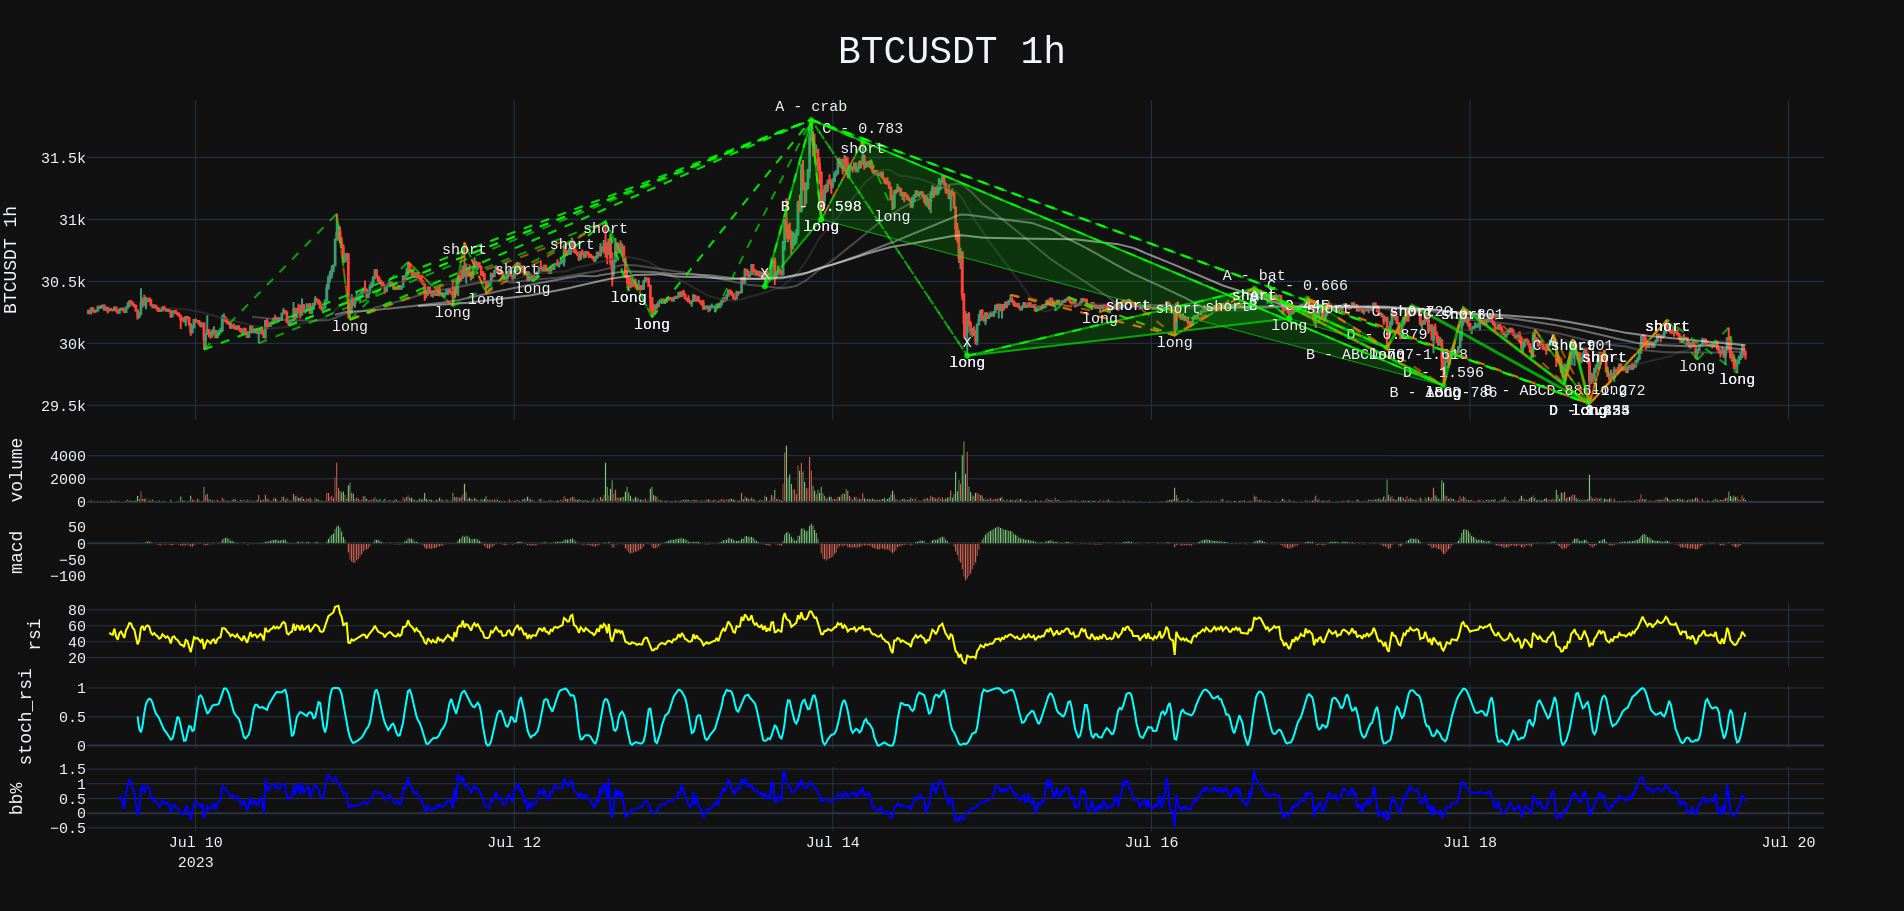
See all harmonic patterns.
1>>> p = Plotter(t, 'BTCUSDT', b.HOUR_1)
2>>> p.add_harmonic_plots(m.get_patterns())
3>>> p.show()
You will see something like this.
See all forming patterns.
1>>> h = HarmonicSearch(t)
2>>> h.forming()
3>>> p = Plotter(t, 'BTCUSDT', b.HOUR_1)
4>>> p.add_harmonic_plots(h.get_patterns(formed=False))
5>>> p.show()
etc.